November's Unemployment Rate Unchanged At 5.6%
Dec. 21, 2001
No. 01-96
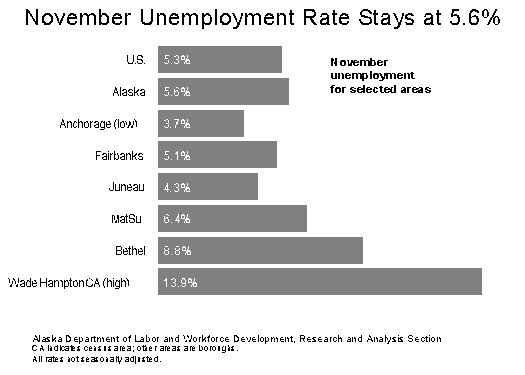
Alaska's November unemployment rate remained unchanged at 5.6%. Typically, the unemployment rate rises slightly from October to November as seasonal employers such as the seafood processing industry reduce employment heading into the winter months. Over the last 20 years the average November rate was 8.2%.
The number of unemployed decreased slightly over the month to 18,064, a 7.9% decrease from November 2000. Initial claims for unemployment dropped 9.6% from October to 8,694. Initial claims are up 1.7% over the November 2000 level.
The comparable national unemployment rate rose three-tenths of a percentage point to 5.3%. The rate has increased for three consecutive months and is up significantly from November 2000's rate of 3.8%.
According to Dan Robinson, a labor economist with the Alaska Department of Labor and Workforce Development, the state's low November unemployment rate is another indication that Alaska's economy has been relatively unaffected by the national recession. As the country's unemployment rate has climbed in recent months, Alaska's has generally declined or shown smaller than expected seasonal increases. "These numbers underline that Alaska's economy often follows different trends than the country as a whole," Robinson said.
Regional unemployment rates generally followed seasonal trends. For example, Kodiak's unemployment rate jumped from 7.2% to 12.8% as the fishing season came to an end. Bristol Bay had a smaller, though comparable, increase from 7.8% to 10.4%. Anchorage's unemployment rate dropped two-tenths of a percentage point to 3.7%, the lowest rate in the state.
At 13.9%, Wade Hampton Census Area once again had the state's highest rate of unemployment, but the rate decreased noticeably from last month's 16.2%. Juneau's unemployment rate dropped five-tenths of a percent to 4.3% and Fairbanks saw a negligible increase from 5.0% to 5.1%.
Preliminary estimates show that wage and salary employment declined by almost 9,000 jobs over the month, or three percent. The estimates show a 1.7% increase over the year-ago level. Service industries and construction have both shown healthy growth over the year, adding a combined total of more than 3,000 jobs since November 2000.
| Labor Force by Region and Census Area | ||||||||||||
| Labor Force | Unemployment | Rates | Employment | |||||||||
| /P | /R | /P | /R | /P | /R | /P | /R | |||||
| nov 2001 | oct 2001 | nov 2000 | nov 2001 | oct 2001 | nov 2000 | nov 2001 | oct 2001 | nov 2000 | nov 2001 | oct 2001 | nov 2000 | |
| Alaska Statewide | 324,742 | 328,410 | 322,180 | 18,064 | 18,372 | 19,607 | 5.6 | 5.6 | 6.1 | 306,678 | 310,038 | 302,573 |
| Anchorage-Mat-Su Region | 182,311 | 182,128 | 180,372 | 7,672 | 7,879 | 8,615 | 4.2 | 4.3 | 4.8 | 174,639 | 174,249 | 171,757 |
| Municipality of Anchorage | 149,110 | 148,233 | 148,466 | 5,545 | 5,845 | 6,276 | 3.7 | 3.9 | 4.2 | 143,565 | 142,388 | 142,190 |
| Mat-Su Borough | 33,201 | 33,895 | 31,906 | 2,127 | 2,034 | 2,339 | 6.4 | 6.0 | 7.3 | 31,074 | 31,861 | 29,567 |
| Gulf Coast Region | 31,969 | 33,252 | 31,932 | 3,142 | 2,885 | 3,441 | 9.8 | 8.7 | 10.8 | 28,827 | 30,367 | 28,491 |
| Kenai Peninsula Borough | 20,326 | 21,373 | 20,250 | 1,847 | 1,907 | 1,986 | 9.1 | 8.9 | 9.8 | 18,479 | 19,466 | 18,264 |
| Kodiak Island Borough | 6,861 | 6,789 | 6,907 | 879 | 488 | 995 | 12.8 | 7.2 | 14.4 | 5,982 | 6,301 | 5,912 |
| Valdez-Cordova Census Area | 4,782 | 5,090 | 4,775 | 416 | 490 | 460 | 8.7 | 9.6 | 9.6 | 4,366 | 4,600 | 4,315 |
| Interior Region | 49,496 | 49,564 | 48,953 | 2,872 | 2,841 | 2,977 | 5.8 | 5.7 | 6.1 | 46,624 | 46,723 | 45,976 |
| Denali Borough | 1,176 | 1,203 | 1,172 | 115 | 140 | 126 | 9.8 | 11.6 | 10.8 | 1,061 | 1,063 | 1,046 |
| Fairbanks North Star Borough | 43,633 | 43,660 | 43,092 | 2,236 | 2,175 | 2,271 | 5.1 | 5.0 | 5.3 | 41,397 | 41,485 | 40,821 |
| Southeast Fairbanks Census Area | 2,599 | 2,633 | 2,590 | 262 | 291 | 285 | 10.1 | 11.1 | 11.0 | 2,337 | 2,342 | 2,305 |
| Yukon-Koyukuk Census Area | 2,088 | 2,068 | 2,099 | 259 | 235 | 295 | 12.4 | 11.4 | 14.1 | 1,829 | 1,833 | 1,804 |
| Northern Region | 8,839 | 9,251 | 9,183 | 764 | 892 | 864 | 8.6 | 9.6 | 9.4 | 8,075 | 8,359 | 8,319 |
| Nome Census Area | 3,316 | 3,463 | 3,465 | 288 | 329 | 346 | 8.7 | 9.5 | 10.0 | 3,028 | 3,134 | 3,119 |
| North Slope Borough | 3,338 | 3,509 | 3,487 | 219 | 280 | 273 | 6.6 | 8.0 | 7.8 | 3,119 | 3,229 | 3,214 |
| Northwest Arctic Borough | 2,185 | 2,279 | 2,230 | 257 | 283 | 244 | 11.8 | 12.4 | 10.9 | 1,928 | 1,996 | 1,986 |
| Southeast Region | 38,918 | 40,055 | 38,279 | 2,400 | 2,509 | 2,463 | 6.2 | 6.3 | 6.4 | 36,518 | 37,546 | 35,816 |
| Haines Borough | 1,234 | 1,260 | 1,199 | 131 | 126 | 117 | 10.6 | 10.0 | 9.8 | 1,103 | 1,134 | 1,082 |
| Juneau Borough | 16,915 | 17,487 | 16,646 | 731 | 847 | 773 | 4.3 | 4.8 | 4.6 | 16,184 | 16,640 | 15,873 |
| Ketchikan Gateway Borough | 7,563 | 7,777 | 7,396 | 555 | 571 | 522 | 7.3 | 7.3 | 7.1 | 7,008 | 7,206 | 6,874 |
| Pr. of Wales-Outer Ketchikan CA | 3,005 | 3,087 | 3,015 | 241 | 246 | 305 | 8.0 | 8.0 | 10.1 | 2,764 | 2,841 | 2,710 |
| Sitka Borough | 4,273 | 4,369 | 4,180 | 204 | 186 | 190 | 4.8 | 4.3 | 4.5 | 4,069 | 4,183 | 3,990 |
| Skagway-Hoonah-Angoon CA | 2,142 | 2,212 | 2,093 | 232 | 248 | 220 | 10.8 | 11.2 | 10.5 | 1,910 | 1,964 | 1,873 |
| Wrangell-Petersburg Census Area | 3,480 | 3,549 | 3,440 | 274 | 253 | 295 | 7.9 | 7.1 | 8.6 | 3,206 | 3,296 | 3,145 |
| Yakutat Borough | 307 | 314 | 310 | 33 | 32 | 41 | 10.7 | 10.2 | 13.2 | 274 | 282 | 269 |
| Southwest Region | 13,209 | 14,161 | 13,463 | 1,214 | 1,366 | 1,248 | 9.2 | 9.6 | 9.3 | 11,995 | 12,795 | 12,215 |
| Aleutians East Borough | 1,364 | 1,441 | 1,401 | 55 | 44 | 68 | 4.0 | 3.1 | 4.9 | 1,309 | 1,397 | 1,333 |
| Aleutians West Census Area | 1,824 | 1,893 | 1,902 | 171 | 130 | 219 | 9.4 | 6.9 | 11.5 | 1,653 | 1,763 | 1,683 |
| Bethel Census Area | 5,531 | 5,980 | 5,590 | 485 | 598 | 452 | 8.8 | 10.0 | 8.1 | 5,046 | 5,382 | 5,138 |
| Bristol Bay Borough | 443 | 460 | 453 | 46 | 36 | 49 | 10.4 | 7.8 | 10.8 | 397 | 424 | 404 |
| Dillingham Census Area | 1,609 | 1,726 | 1,602 | 147 | 166 | 113 | 9.1 | 9.6 | 7.1 | 1,462 | 1,560 | 1,489 |
| Lake & Peninsula Borough | 539 | 579 | 571 | 47 | 54 | 70 | 8.7 | 9.3 | 12.3 | 492 | 525 | 501 |
| Wade Hampton Census Area | 1,900 | 2,083 | 1,943 | 264 | 338 | 277 | 13.9 | 16.2 | 14.3 | 1,636 | 1,745 | 1,666 |
| 2000 Benchmark | ||||||||||||
| /P = Preliminary /R = Revised | ||||||||||||
| Comparisons between different time periods are not as meaningful as other time series produced by Research & Analysis. The official definition of unemployment currently in place excludes anyone who has not made an active attempt to find work in the four-week period up to and including the week that includes the 12th of the reference month. Due to the scarcity of employment opportunities in rural Alaska, many individuals do not meet the official definition of unemployed because they have not conducted an active job search. They are considered not in the labor force. | ||||||||||||
| Alaska Nonagricultural Wage & Salary Employment | |||||
| preliminary | revised | Changes from | |||
| 11/01 | 10/01 | 11/00 | 10/00 | 11/00 | |
| Total Nonagricultural Employment | 282,800 | 291,700 | 278,100 | -8,900 | 4,700 |
| Mining | 10,600 | 11,700 | 11,100 | -1,100 | -500 |
| Construction | 14,600 | 16,700 | 14,100 | -2,100 | 500 |
| Manufacturing | 8,900 | 11,900 | 9,500 | -3,000 | -600 |
| Transportation, Commun. & Utilities | 26,300 | 27,000 | 26,100 | -700 | 200 |
| Trade | 59,100 | 59,300 | 57,700 | -200 | 1,400 |
| Finance, Insurance & Real Estate | 12,600 | 12,800 | 12,600 | -200 | 0 |
| Services & Misc. | 74,200 | 75,600 | 71,600 | -1,400 | 2,600 |
| Government | 76,500 | 76,700 | 75,400 | -200 | 1,100 |
| Government includes employees of public schools and the University of Alaska | |||||
| Benchmark March 2000 | |||||
| Seasonally Adjusted Unemployment Rates | ||||
| November 01 | Alaska | 5.7% | U.S. | 5.7% |
| October 01 | Alaska | 5.4% | U.S. | 6.0% |
| September 01 | Alaska | 4.9% | U.S. | 6.5% |
Benchmark: March 2000 Source: Alaska Department of Labor and Workforce Development, Research and Analysis Section.
- Comparisons between different time periods are not as meaningful as other time series produced by Research and Analysis.
- The official definition of unemployment currently in place excludes anyone who has not made an active attempt to find work in the four-week period up to and including the week that includes the 12th of the reference month. Due to the scarcity of employment opportunities in rural Alaska locations, many individuals do not meet the official definition of unemployed because they have not conducted an active job search. These individuals are considered not in the labor force.
###